How to measure Citrix Provisioning Server performance
To make Citrix Provisioning Services (PVS), you must rely on block I/O cache. In this case, we will be using Windows 2008 R2 X64.
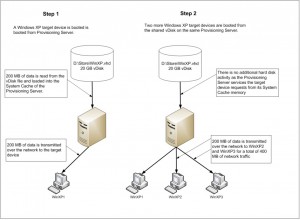
When an endpoint logs into PVS, the read I/O for that device then points back to the vDisk hosted on the PVS server. Doing this, you need to make sure you have plenty of memory available for the PVS server to cache this I/O. That way, when read I/O’s come in; they are served out of memory rather than going back to disk.
This being said, you then need to be able to determine just how much of your I/O is coming out of cache versus how much I/O Stream Process is generating. From that, you can determine how efficiently your PVS environment is running.
The counters that you’re going to want to measure and compare are:
\\Process(StreamProcess)\\IO Data Operations/sec
and
\\cache\\copy read hits %
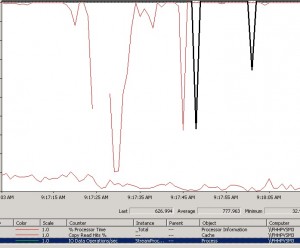
The I/O Data Operations/sec counter is the counter that tells you how much I/O is being generated by StreamProcess.exe.
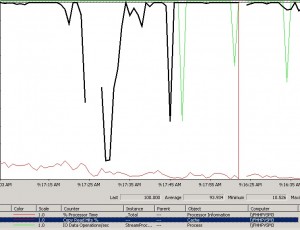
The Copy Read Hits % is the counter that tells you what percent of read I/O being served is coming from system cache, not disk.
As you can see below on this production system, the average amount of read I/O coming out of cache is 93% which is good. The higher the number here, the better.
As you can see below on this production system, the average amount of I/O being generated by Stream Process is 770. This is not a very heavy load in this environment. This number will vary by environment, so take various baselines in your environment to figure out what a “healthy” number is for you.
Great Reference:
http://support.citrix.com/article/CTX125126
PVS Tips:
- The more vDisks you have, the more PVS memory you need for cache.
- VirusScan is a great tool to force PVS to cache the contents of a vDisk.
- CIFS can be an effective datastore for PVS – Citrix Blog Post


