your home for end-user virtualization!
Using vSAN RVC to learn more about your vSAN environment
The vSAN Ruby vSphere Console (RVC) is a very-much undocumented feature of vSAN that allows you to explore some pretty kick-ass features of vSAN in terms of what-if scenarios, cluster info, and dashboard information from the vCenter server appliance.
To access the vSAN RVC, simply ssh to your vCenter server appliance and run:
rvc root@localhost
This will drop you into the RVC shell once you enter the root password:
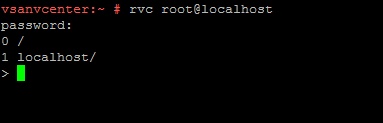
vSAN RVC Shell
From here, you can access the vCenter environment similar to that of a directory structure:
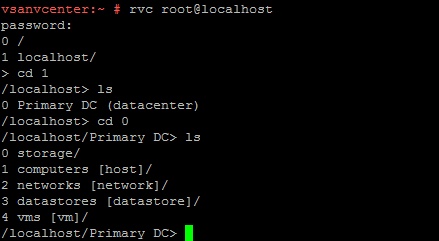
vSAN RVC Shell Directory Structure
From here, I like to assign variables to make the execution of commands much easier.
RVC Shell Variables
The RVC command vsan.cluster_info is a command that allows us to see each the host details of each node within the vSAN cluster.
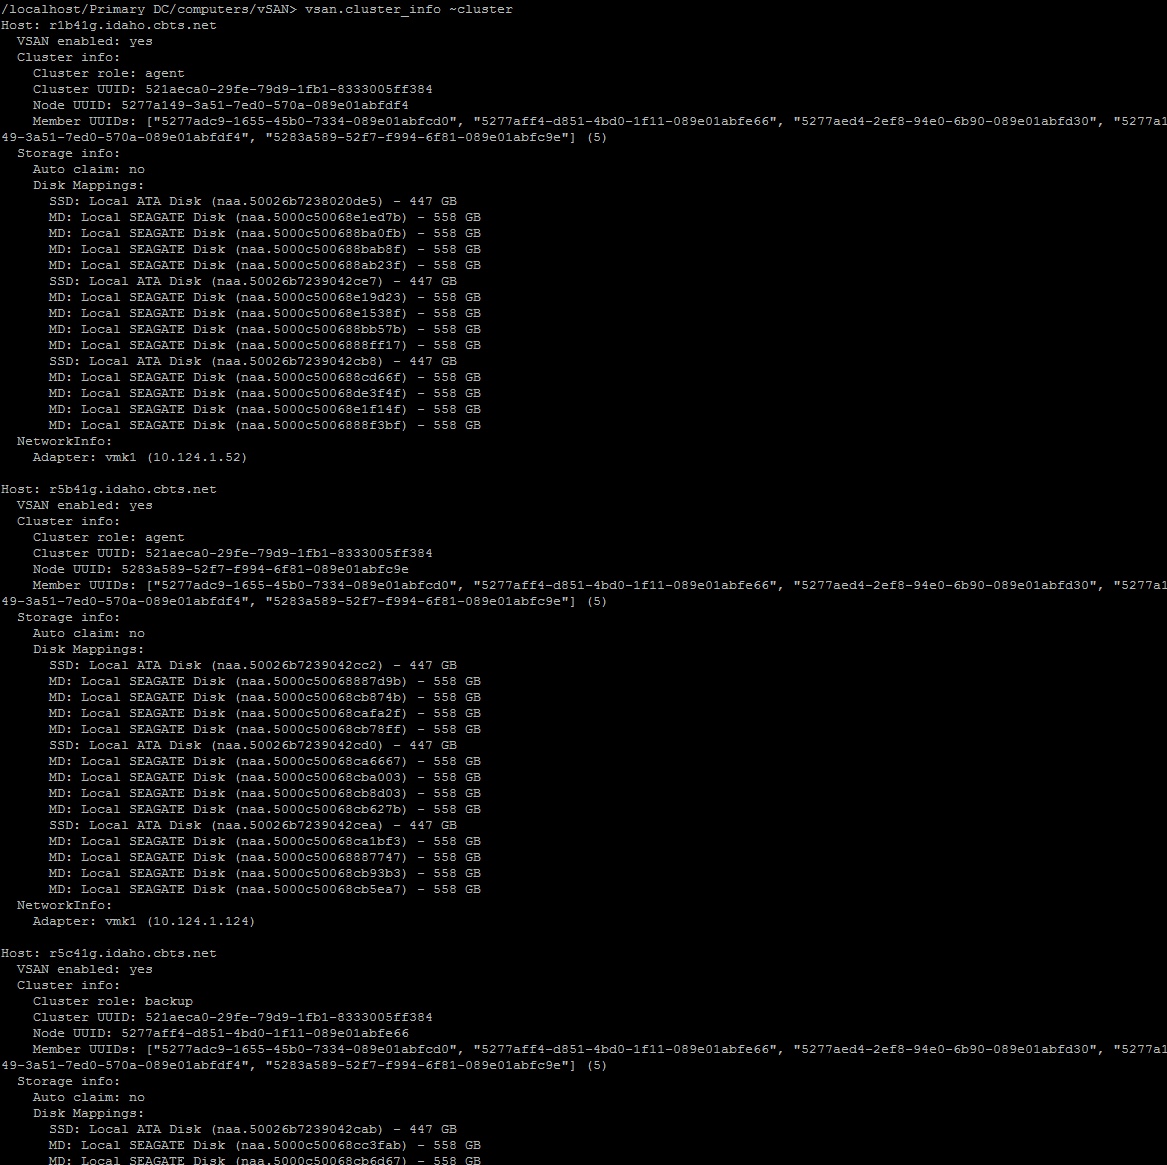
RVC vsan.cluster_info
Another favorite command is vsan.whatif_host_failures. This command provide the pre/post counter information before and after the simulation of a single host failure. This is an awesome feature that allows you to readily see what you’re resource would be should a host failure occur.
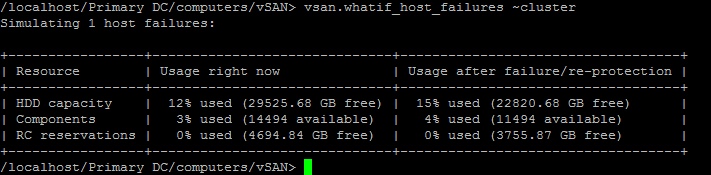
vSAN RVC vsan.whatif_host_failures
vsan.check_limits is another useful RVC command. It gives per-host info on how much of the stated Virtual SAN limits are being consumed, including:
- # Assocs (20,000 per host limit)
- # Sockets (10,000 per host limit)?
- # Components (3000 per host limit) # Disk utilization per disk
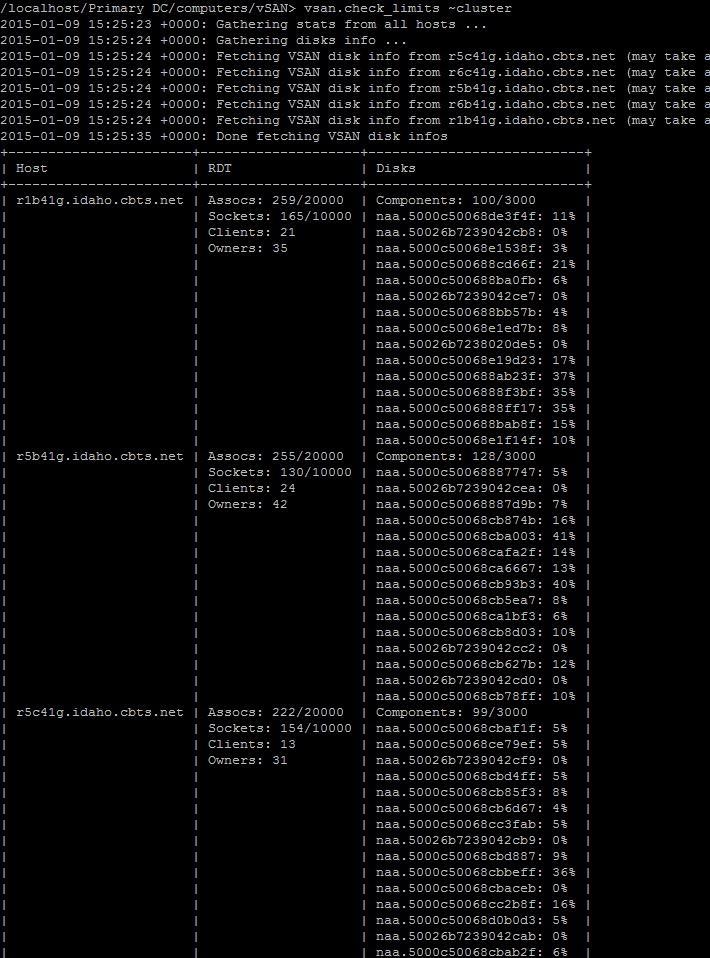
vSAN RVC vsan.check_limits
vsan.check_state is a command that runs through three steps to verify the current health of the VMs living on the Virtual SAN datastore.
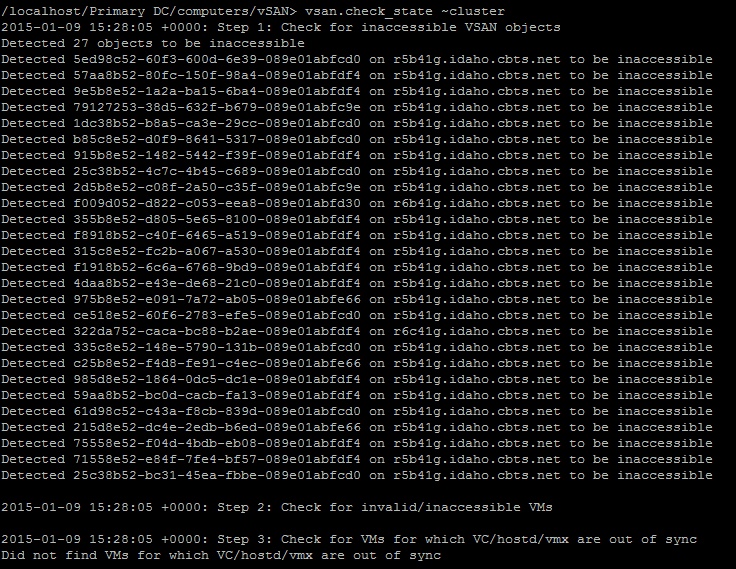
vSAN RVC vsan.check_state
and as you can see, there appears to be an issue on one of my hosts with inaccessible data..
Another cool tool is the vSAN observer, to use it; run:
vsan.observer ~cluster --run-webserver --force
And then go to: http://vCenterServer_hostname_or_IP_Address:8010
It make take a few minutes to generate enough statistics to populate the graphs.
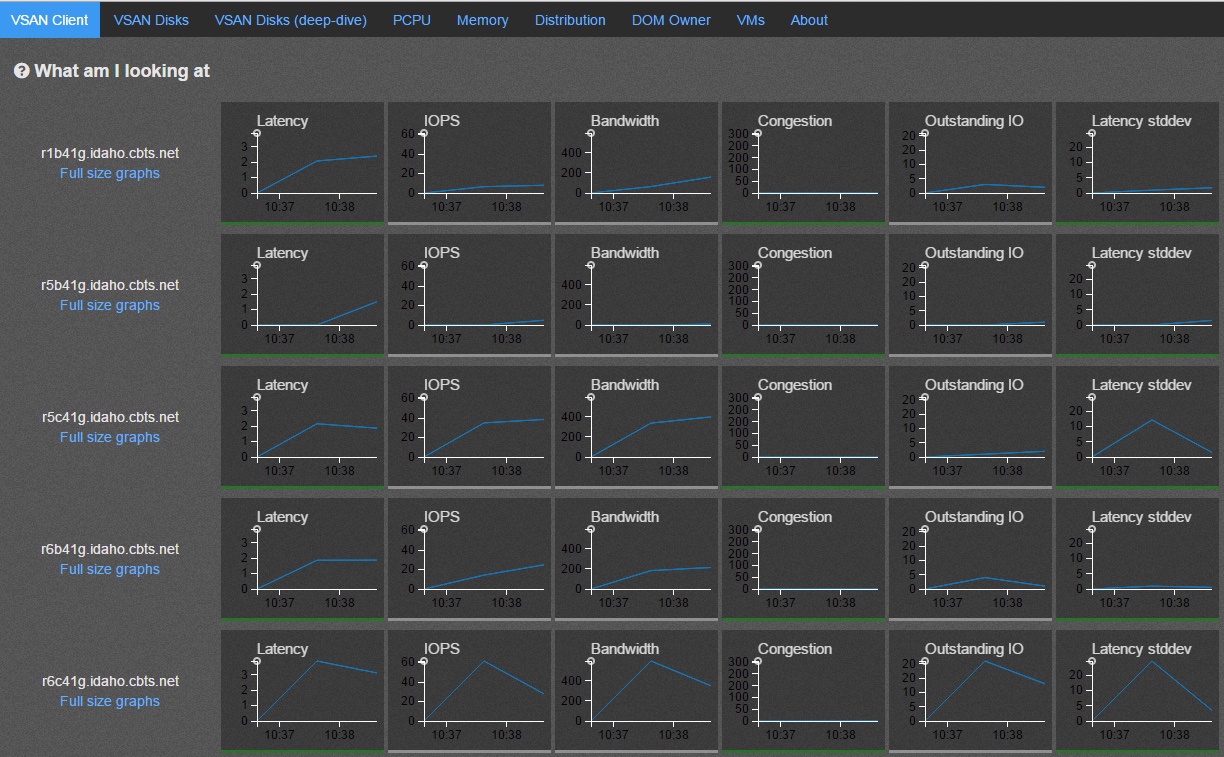
RVC vsan.observer
Note, you need to stop the vsan.observer when you are done, otherwise it will continue to run in the background.
In total, there are 29 commands available to interact with the vSAN namespace.. the list of those can be found here: and here in the RVC Command List.
Tags: RVC, vmware, vmware vsan, vSAN